Oil Sands: Canadian Natural and MEG Energy Wrap Reporting Season
Excerpt from Footnotes and Flashbacks: Week Ending March 3, 2023
When we first started looking at oil sands credits in detail back in 2017 after the oil sector crisis, one motivation was that the sector seemed to be somewhat of an orphan in street equity coverage, seldom covered in the US financial media, not cited much in many of the usual US industry trade rags, and usually neglected by sell-side credit analysts. We discovered that a lot of dedicated Canadian coverage in the trade literature was available (Daily Oil Bulletin/JWN on the favorites list) and there was no shortage of trade groups and experts offering reams of information and data on the topic (Alberta regulators, CAPP as a trade group, Canadian Energy Centre, and others).
The visibility and coverage of the sector has changed since that period. The major oil sands players navigated an oil crash and a COVID meltdown that along the way saw sustained industry consolidation, soaring free cash flow and balance sheet repair. That has helped establish some of the names as core holdings in both debt and equity portfolios and more firms can trade and underwrite such names with confidence.
The “Canadianization” of oil sands over the past decade and a renewed focus on national security and energy after Russia-Ukraine and North American energy independence should bring the Canadian players much more into the US policy discussions. The role of pipelines will complicate the positions on the left and the US -centric mindset on the right might be a headwind. A coherent energy policy debate during the 2024 election craziness will require consideration of LNG and oil export dynamics and where heavy Canadian crudes can play a role in where US production gets directed.
Post-2016, post-COVID lessons…
What we found in the aftermath of the oil sector meltdown in 2015 into early 2016 was that the Canadian majors comprised a very interesting sector that needed an analytical framework more like processing industries and manufacturers than what our energy team was working on with the flood of leveraged and financially stressed upstream operators in the shale sector. The debt-funded capex exploration directed all attention to the complexities associated with the boom in unconventional and emerging drilling technologies. The names were blowing up. Default rates were soaring, and the IG names in Canada and the one major oil sands name in US HY (MEG) just did not draw the investor focus.
The main US HY issuers were all about short-cycle investments with high decline rates, high reinvestment needs, and shorter payback periods. The oil sands companies were very long cycle, very long-lived and came with over-the-top capital intensive histories to the point of multi-year buildouts running into billions per project. Oil prices had fueled a lot of smaller start-ups in oil sands (“oil sands juniors”), but the great risk in oil sands was that volume was needed to bring down unit costs. That meant smaller projects were doomed when oil collapsed.
When the smoke cleared there were a few major IG issuers and one major HY name (MEG Energy). As a group, the Big 4 and MEG targeted major projects and spent big as integrated oils from the US and Europe exited to chase short cycle projects in the US or faced ESG pressures at home. Those are stories for another day as we ramp up on some of our former coverage names.
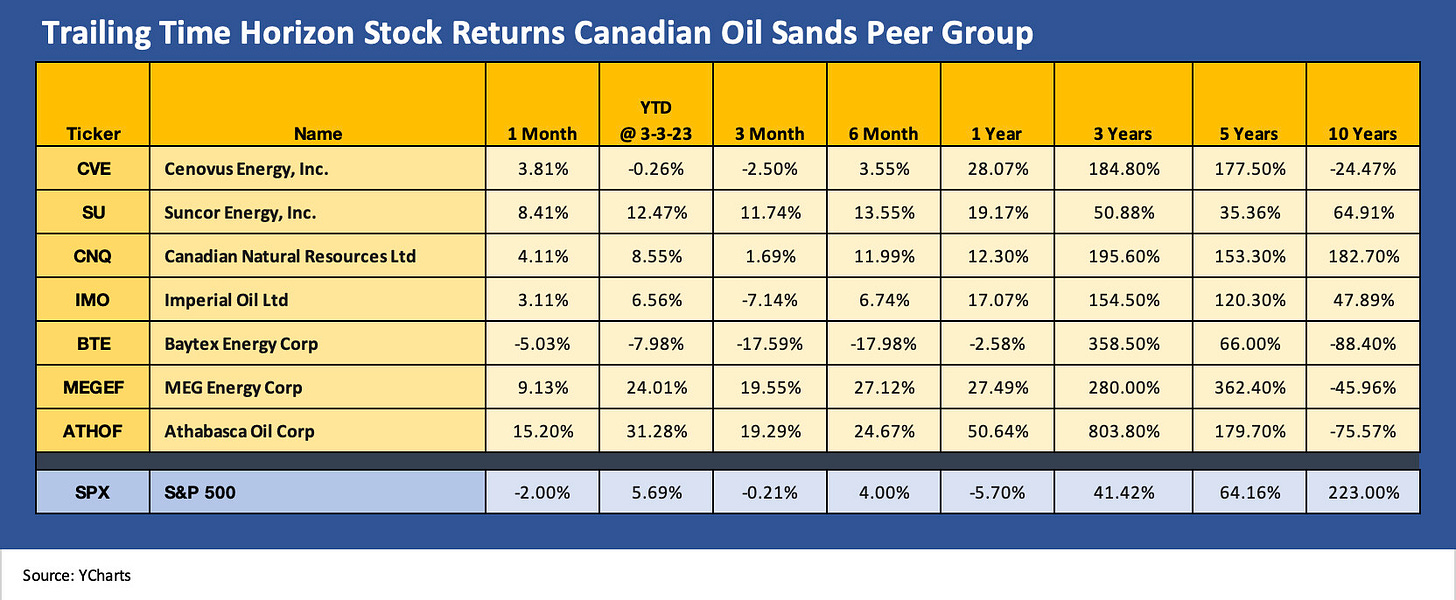
The chart above takes a look at how some of these stocks have framed up across time. Suncor boasted the largest market cap for a protracted period on the back of its diversified business mix before CNQ took off. For CNQ, the biggest growth came after major acquisitions that ran alongside highly successful expansion programs. Canadian Natural Resources is now the behemoth of the group in upstream operations and reserve base. CNQ would be a Top 20 producer as a nation unto itself.
Cenovus has dramatically reduced its business risk profile and enriched its operating asset diversity this past cycle with its acquisitions. Imperial operates as an arm of Exxon while MEG is the smaller but a high quality operator that many assume will get rolled into one of the Big 4 someday. CNQ and CVE have been the most acquisition-oriented of the group.
Big 4 of Oil Sands is comprised of Canadian Natural (CNQ), Suncor (SU), Cenovus (CVE), and Imperial Oil (IMO, an Exxon unit) with MEG Energy (MEGEF) also now a big name—a more distant #5 but considered a very high-quality asset. Consolidations has been a theme. MEG fought off a Husky Oil takeover attempt and then later Cenovus bought Husky. CNQ’s free cash flow exceeds the market cap of MEG Energy, so MEG would be an easy purchase for CNQ.
On the stock list in the chart, Baytex comes with the asterisk of being a major player in the US in the Eagle Ford and this past week announced a bid for Ranger Oil. BTE it is not in the major Canadian oil sands peer group and has a broad portfolio in the US as well. Athabasca is a smaller player in oil sands but like the leaders is also active in the Montney and Duvernay in its asset mix. The story over the past decade for the Canadian players has been about ongoing portfolio management of reserve profiles.
Low operating costs and attractive breakeven rates for sustainable capex levels…
The capex intensity of oil sands, which was more like building a town than a drill site, earned the oil sands players the tag of high cost, when in fact these operations boasted very low unit costs once they were up and running. These projects were slowly winding down and the plunging unit costs, as the volumes ramped up, started to make believers of more investors in investment grade names. During the 2016 oil trough names such as Cenovus and Canadian Natural that saw their bonds plunge to distressed levels as market liquidity in these names saw the dark side of the “slow down bid.”
The market has learned a lot about these names since. These were mostly companies with strong bank group support and were household names in Canada. They also had more than a little political support in Alberta that would have crossed into liquidity support if it came to that during the COVID crisis, when a barrel of Western Canadian Select was trading flat to a bottle of Molson.
We will look at those histories and evolutionary period for these names in the market when we return to doing more single name work in the subsector.
The past week, Canadian Natural and MEG Energy weighed in…
When we looked at CNQs numbers this past week, we start to wonder if they will look more aggressively at more M&A across 2023-2024 given the scale of free cash flow in excess of sustaining capital needs. The choice is return to shareholders or make acquisitions and grow the reserve base and diversity. We will be out in more detail on the major oil sands names in the near future.
CNQ posted 2022 results last week, which included C$19.8 bn in adjusted funds flow and free cash flow of C$10.5 billion. That in turn drove material debt reduction and shareholder rewards with C$3.2 bn in debt reduction and C$10.5 bn in combined dividends (C$4.9bn) and buybacks (C$5.6bn). The company changed its shareholder policies to allow for 100% of free cash flow to be distributed to shareholders once the net debt level reaches C$10 bn. That was more generous to shareholders than the prior target of C$8 bn as the reserve base and higher production levels allowed CNQ to justify it. That does not change our view that CNQ offers both massive asset protection and highly discretionary cash flow even at much lower oil price levels.
Last but not least, MEG Energy’s results capped off a banner year as well. With C$1.55 bn of free cash flow after capex, MEG was able to pay down US$ 1.0 bn in debt (C$1.3 bn) and buy back 7% of its stock. With operating expenses of C$7.91 per bbl, the cushion in the numbers for MEG is very impressive for its credit ratings and relative cash flow. Energy operating costs net of power revenue are only C$ 3.18. Low unit costs have been a hallmark of the MEG story across the oil crises.
MEG will keep buying back shares and expect another 10% in 2023 but will continue to reduce debt. A new policy announced by MEG indicates it will allocate 25% of free cash flow to buybacks and the remainder to reduce debt. The ratings have always been all over the place across the rating agencies on this name, but the risk is clearly in the crossover quality zone at this point. MEG is still housed in the B tier of the index, but the market says otherwise.


