
JOLTS Mar 2025: No News is Good News
The JOLTS report with its 1-month lag from March did not smoke out any signs of panic before “Liberation Day.”


Swimming in tariffs…come on in, the water’s fine.
The main message from JOLTS was there were no signs of fear or panic in the March numbers. There were over 900K fewer job openings YoY, but the sequential move was small at -3.9% with -3.5% in the private sector and -6.6% in the government sector (-26.9% in Federal). The words “little changed” are a BLS favorite, but the direction is lower for job openings.
Hires rose in total sequentially at less than +1% with YoY hires down by -1%, so that it is not flashing a trend either way. Quits sequentially were up +2.5% and flat YoY.
The fact that layoffs and discharges in March were down by over 12% MoM does not show payroll nerves at all, so it will be interesting to see this week if the Friday April payroll numbers show any more immediate reactions after Liberation Day.
Total separations of all types were down by -3.4% with the “total separation rate” ticking slightly lower to 3.2% of total employment and still running in a narrow range.
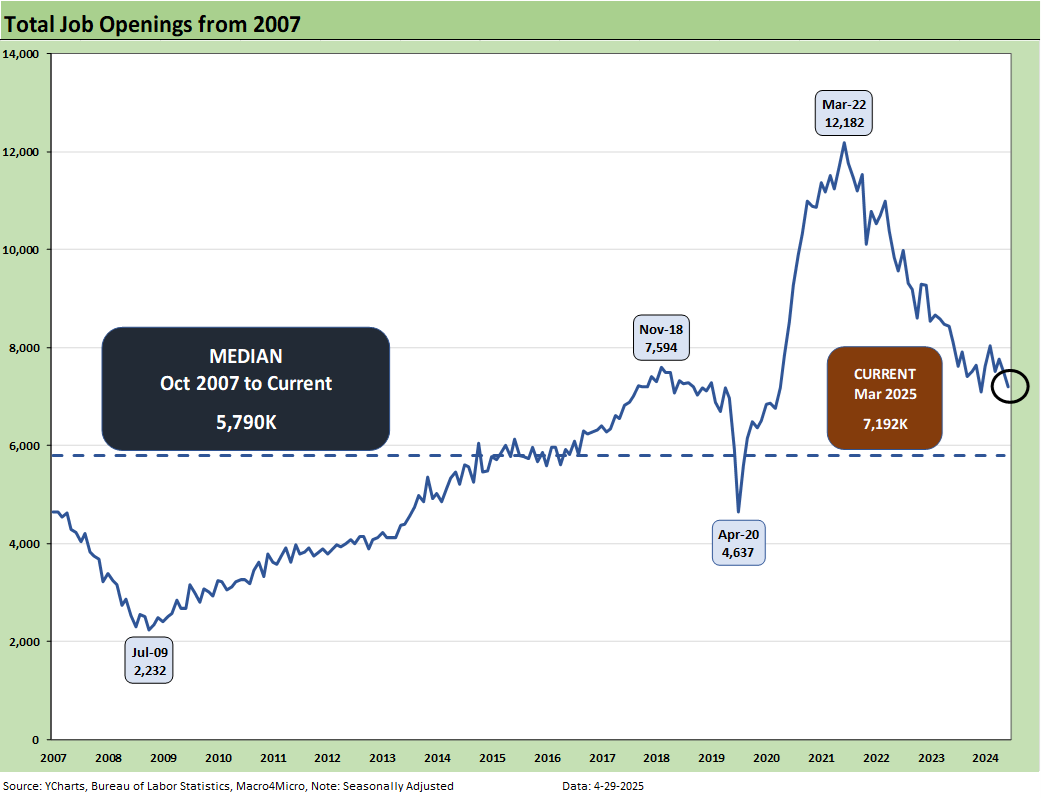
Last month’s JOLTS was released the day before Liberation Day, so it has been a very eventful rolling month in April since then. JOLTS is at a 1-month lag, so we still look to this Friday’s payroll release. We see the number for Job Openings holding in well enough for March data at 7.2 million. That is not that far from the peak number of Trump 1.0 as detailed in the chart above.

The above chart plots Hires vs. Layoff/Discharges on a SAAR basis. We remove the COVID numbers from this chart to support the visual value for “normal” periods. Those COVID impacts are detailed further below. As noted in the bullets at the top, Hires were up slightly sequentially and down YoY. Layoffs/Discharges were down, so that is a positive combination MoM.

The above chart updates the ratio of Hires to Layoffs/Discharges. The relationship improved sharply this month to 3.47 and is comfortably above the long-term median presented from 2007. That post-2007 period includes the longest recession since the Great Depression and the COVID pandemic.

The above chart plots Hires vs. Total Separations on a SAAR basis. Separations include Quits, Layoffs/Discharges, and “Other Separations.” We remove the COVID numbers from this chart to support the visual value for “normal” periods. Those COVID impacts are detailed further below. Separations in total were down by -179K sequentially, which was a large decline vs. last month’s increase.
We typically do not find “Total Separations” very interesting as a multi-line net number. The most important moving parts are Hires and Layoffs/Discharges. “Other separations” could get more interesting in a world of mass deportation when people get “disappeared.” Did they “quit” by not showing up for work or did they get “othered.” For March, “Other Separations” are not telling much of a story and moved lower.
There is also the uncertainty of how the de facto labor force gets measured and how many are “off the books.” As the year goes on, those questions could be more important. “Other Separations” were down by -39K in March.
The above text box is our recurring recap of the COVID period. Almost 28 million Separations combined in March-April 2020 was a brutal reminder of that period. That hopefully will be the last time we ever see that. With RFK at the helm, you can never say never.

The Hires Minus Total Separations differential is plotted above. Hires moved higher and total Separations moved lower. The net number thus moved higher sequentially and almost doubled from last month to +274K. That is well above the long-term median of +186K.

The time series for Total Quits as a % of Separations (SAAR basis) rose this month to 64.9% from 60.7% and is well above the long-term median. The classic “Quits Rate” is measured by Total Quits as a % Total Employment, and that metric ticked higher on the month to 2.1%. The Quits rate is flat YoY at +2.1%.