
Credit Crib Note: AutoNation (AN)
We look at the financial and operating fundamentals of AutoNation (AN).

CREDIT TREND: Stable
AutoNation has bond maturities in 2024 and 2025, so it will be in the market this year and next to refinance while acquisition activity could add more to the total. The good news is that the company is a healthy discretionary free cash flow generator and has a respectable balance sheet with prudent leverage targets of 2x to 3x that has still allowed for generous deployment of capital to shareholders in the form of buybacks.
The potential for materially more aggressive debt-financed M&A would be inconsistent with its history, but M&A is overdue for acquisitions given the industry context. AN is maintaining its operational focus on execution in its used car operations as well as the buildout of growth opportunities for its captive finance unit. A growing finance operation should (in theory) promote sustained prudent financial policies to benefit funding costs, broaden the range of market alternatives, and support AN’s ability to grow that business line profitably.
AN is rated investment grade in what is generally a BB tier peer group of public dealers. The company has ample room to maneuver in credit quality at this point given its track record and disciplined approach. Aggressive overseas expansion would be a riskier move for AutoNation in execution risk, and that profile of transaction might take a sales pitch from management to the rating agencies.
OPERATING PROFILE:
Based on units, AutoNation was the #1 auto retailer and the largest of the US based auto dealer groups from 1997 through 2021 until Lithia took the crown after LAD’s ambitious M&A program and rapid expansion in used cars. That left AN at #2 in new vehicle unit sales and as well as #2 in used vehicles. That scale will serve AN well as it looks to build out its captive finance unit and branded use car operations (AutoNation USA).
AN is fairly well balanced in its mix across the new and used vehicle operations. In terms of reporting segments, the Import segment is generating more in dollar sales volume than the Domestic segment while the Premium Luxury segment is the highest in revenues and segment income as well as margins as of FY 2023 and into1Q24.
The new vehicle retail operations are the largest by revenue, but Parts & Services (P&S) is by far the most profitable operation based on gross profits and continues to expand. The P&S operation remains a priority for more growth and extension of services and product offerings that complement the Finance and Insurance (F&I) business.
The mix of the new and used business line fundamentals and growth of P&S and F&I mitigates some of the cyclical risk. A systemic bank crisis in 2008, the bankruptcy of 2 of the 3 legacy Detroit 3 in 2009 (GM, Chrysler), a downsizing of the third major domestic (Ford), and the sustained operating and financial strength across a pandemic should reassure investors about the resilience of AutoNation across cycles.
FINANCIAL TRENDS:
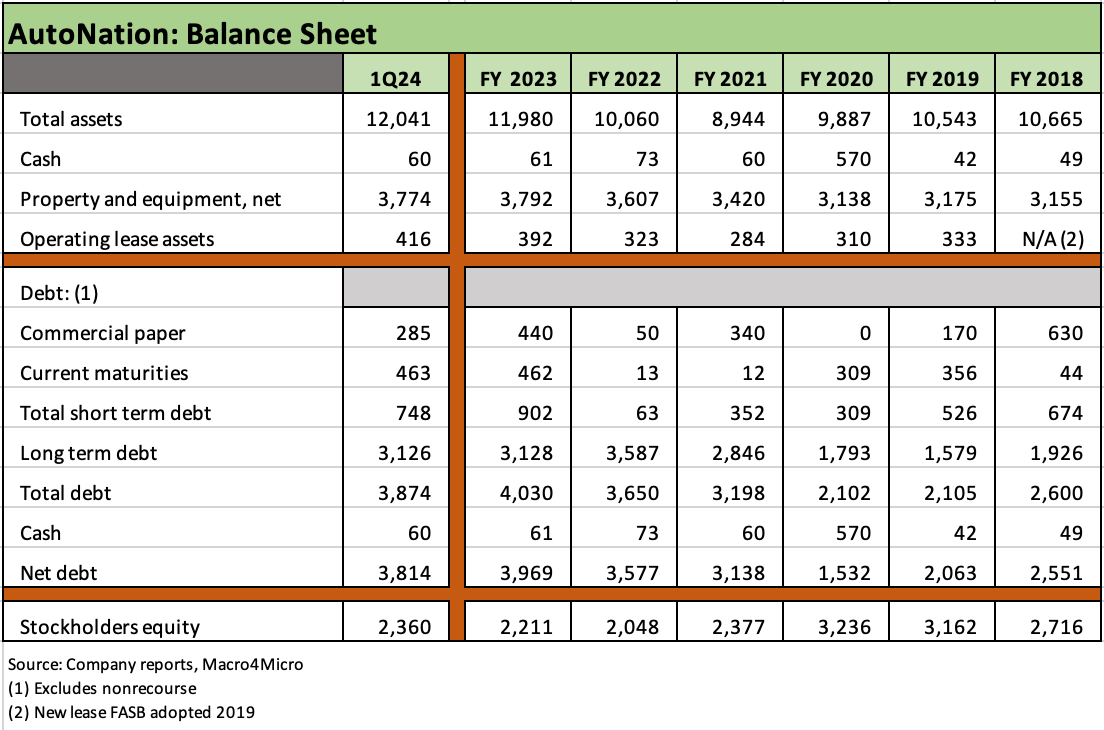
Balance sheet leverage is at the high end of the post-COVID period but remains at the low end of AN’s target range of 2x to 3x. The leverage covenant as defined in its unsecured credit lines calls for a max of 3.75x and AN ended 1Q24 at 2.25x after 1x-handles from FY 2020 to FY 2022. During 2023, AN changed one covenant from a book capitalization ratio (max of 70%) to an interest coverage ratio with a floor of 3.0x vs. the 1Q24 level of 5.3x.
With very strong free cash flow in a steady light vehicle market, AN has considerable discretion in targeting its leverage range subject to its next M&A action, the pace of its captive finance buildout, and how its share price action dictates buyback activity. AN’s share count of around 89 million shares 5 years ago is now down to around 42 million shares as steady free cash flow has made buybacks the cornerstone of the capital allocation.
AN posted revenues in FY 2023 only +14.3% higher than FY 2019. It is worth highlighting that over those 5 years, AN equity has impressively outperformed the S&P 500 and the highly acquisitive Lithia by a large margin. A steady strategy and disciplined financial policies have worked for both shareholders and bondholders.
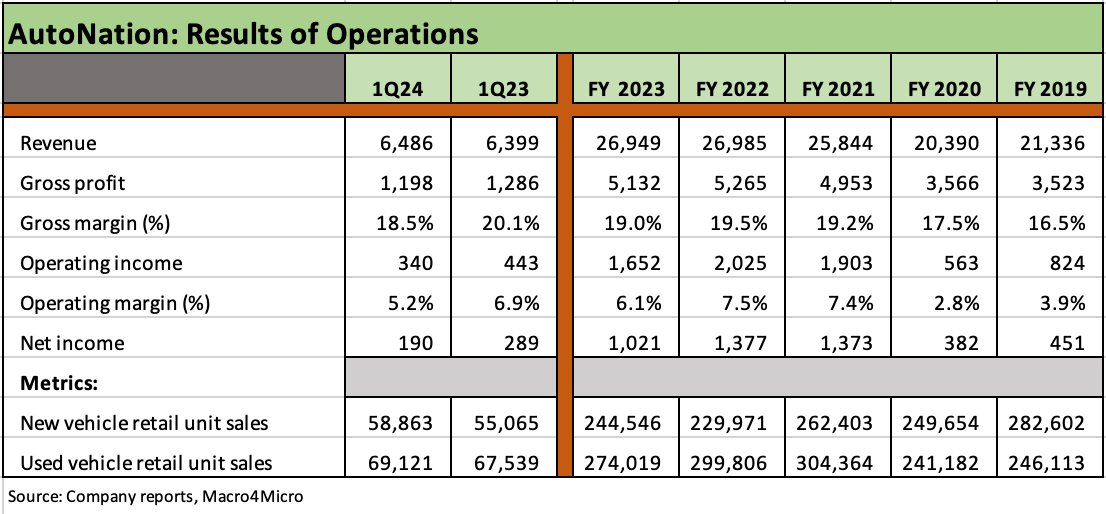
The above chart breaks out revenue, profit, and margin trends. We also break out unit volumes for new and used vehicles. AN lends itself to a traditional analytical framework of “price x volume” with an eye on segment mix and the usual cyclical overlay of consumer financial health and replacement cycles in new and used autos.
The post-COVID cycle has been distorted by a mix of supplier chain disruptions (notably in semiconductors) that roiled the new car market, dislocated used car prices and strained affordability.
Light vehicle SAAR is close to 16 million units after a high mix of months near 12 and 13 million handles in 2021 and 2022, largely on supplier chain problems (even beyond chips). The COVID period saw a low of 8.5 million SAAR in April 2020.
Rising rates during a rare inflation war and material Fed tightening has hurt affordability on the monthly payment effects and, together with production challenges, sent 2022 to recession volume levels on new vehicles.
After a decent rebound in AN volume off the 2020 lows, AN posted strong results in 2021-2022 on strong pricing but has seen profitability pressured in 2023 and into 2024. Post-COVID volumes peaked in 2021 for both new and used vehicles, but gross profits and operating profits peaked in 2022.
The supplier chain problems and freight and logistics challenges among other COVID-related challenges generated some outsized supply-demand imbalances in both new and used cars that elicited a range of reactions along the retail and supplier chain. Higher unit pricing was the main one that flowed into retail and sent AN margins higher with used vehicle margins peaking first followed by new vehicles.
The supplier chains improved in 2023 and allowed for favorable volume variances in new vehicles vs. 2022 while used volumes turned lower. For the full year in 2023, Domestic, Import, and Premium Luxury all reported decreases in segment income with revenues mixed (Domestic down, Imports higher, Premium Luxury flat).
The FY 2024 period is off to a respectable but mixed start with new and used unit sales higher, new vehicle dollar sales higher, but used vehicle dollar revenues slightly lower, “After Sales” (P&S) revenues were higher and Customer Financial Services (CFS) slightly higher. Overall, gross profits declined YoY as gross profit per vehicle was pressured for new and used.
The current period in June 2024 is showing a material increase in OEM-based incentives to keep sales volumes supported. Such incentives are always a wildcard to support dealer sales.

AN goods and services lines are wrapped around the retail sale of new and used vehicles, parts and services (“P&S”) and financial and insurance products (“F&I”). AN provides detailed revenue and profitability details on each of those.
We look at reporting segment results separately with a full range of revenue, profits and unit volumes in the next section. The segment information focuses more on the relative revenue and profitability across the brand franchises (Domestic, Import, Premium Luxury).
Above we see the gross margins on New Vehicles vs. Used Vehicles in the timeline above showing Used margins higher than New Vehicles in 2019-2020 and then margins favoring New Vehicles from FY 2021 through 1Q24. The new vehicle availability improved off the tight conditions of 2022, and the demand side of the equation remains favorable into the 2024 period through 1Q24 for both new and used (see prior chart for unit volume data).
The Parts & Service segment (also called “After-Sales”) has been an exceptional performer and offers by far the highest gross margins and competitive advantages across the cycles. The rising costs of repair are evident in the monthly CPI data. That rising CPI is revenue and profit to AN.
In the P&S segment, dealers have the edge on product knowledge of the increasingly complex vehicles and software, availability of mechanics and diagnostic professionals on site, warranty terms that favor dealer owned services, and local relationships and convenience that favor the dealer operations.

The Segment disclosure is framed around brands with the 3 reportable segments for vehicles: “Domestic” which includes the brands of the Legacy Detroit 3; “Imports” (brand-based, not on where the vehicles are manufactured), and “Premium Luxury” (example: Toyota is in the Import segment while Lexus is in Premium Luxury). Cadillac and Lincoln are in the domestic bucket and not in Luxury.
Geographic concentrations include 63% of total revenues generated in California, Texas, and Florida. The idea of that mix constituting regional concentration risk is tempered by the fact that those states rank (at my last check) at #5, #8, and #14 as nations in terms of GDP. Those are “driving states” with varied tastes in products (notably TX in trucks and CA for imports).
The acquisition of CIG Financial in 4Q22 could eventually translate into another reportable business segment in the future as AN expands its captive finance operation. For now, the captive finance business rolls up under “Corporate and Other.”
The AutoNation USA used vehicle stores, parts distribution and collision centers, and mobile repair operations are housed in the Corporate and Other segment along with auto finance.
The margins in the three vehicle segments line up as one might expect with Domestic posting the lowest profit margins while Import and Premium Luxury margins are higher.
While a separate topic, the higher margin profile for Imports and Premium Luxury at AN highlight why import dealers have been priced historically at higher multiples. That is also a reason why Penske Automotive Group avoided the domestics by strategic design (only 1% US brands) and boasts the largest market cap of the Big 6 public dealers.
Premium Luxury had the advantage over the Import segment in 2019-2020, but Import margins pulled slightly ahead in 2021-2022. Luxury was slightly ahead in 2023 and posted a bigger lead in 1Q24.

The above chart details a few key line items for AN with stock repurchases being the largest use of cash by far. AN was involved in the bidding process for Pendragon against Lithia and Penske (won by Lithia), but the main event has been buybacks.
In terms of capital allocation, AN does not pay a dividend but has repurchased $5.1 bn in stock from FY 2021 through the1Q24 reporting date. The 1Q24 amount above shows only $39 mn in buybacks during 1Q24, but that buyback total rose to $250 million by the time of the 1Q24 press release. The AN Board approved another $1 bn buyback authorization during 2024.
Acquisition activity in the franchise dealer space is usually bolt-ons and acquisitions of private dealerships, so there is considerable discretion around timing, selection, and relative valuation.
The prices being sought by dealers may not seem economical relative to buying back shares, so the equity markets have not punished AN for its relative caution and appears to have rewarded the stock performance.
To underscore the restraint of AN in M&A, the 5 years from 2019 to 2023 saw the M&A line total $902 million. That contrasts with Lithia’s aggression as evident in $7.0 bn of LAD deals the past 5 years with 4 of those 5 years posting M&A total above $1 bn including $2.7 bn in the hot 2021 market. LAD used debt and was also a major issuer of common as part of its impressive growth plan.
AN posted capex levels at only 1.3% of revenues over the trailing 3 years, so the capex intensity of dealers is still low in multi-industry context.
Even with low capex intensity, capex plans are nonetheless important for many dealers given the real estate needs of the business (store upgrades, P&S expansion, investment in reconditioning facilities, etc.).
The capex demands from the OEMs need to be met for a range of reasons (including EV needs) while growth in used car operations, investment in digital capabilities, and the expansion of lucrative parts and services operations favor the largest dealers on basic economies of scale.
AN discloses its credit ratios as defined in its credit agreement each quarter, and we break those out in the chart below for the latest covenants (EBITDA-based leverage test with a max of 3.75x) and a fixed charge coverage test (minimum of 3.0x).
During July 18, 2023, AN amended the unsecured credit agreement to increase the revolving credit facility commitment from $1.8 billion to $1.9 billion and extend the maturity date of the facility to July 18, 2028. At 1Q24, revolver availability was slightly under $1.9 bn.
AN has $450 mn in bonds maturing in 2024 ($450 mn of 3.5% due 11-15-24) and another $450 million in bonds due in 2025 (4.5% of 10-1-25), so AN will be in the market to refi and extend those maturities along the way separate from any M&A supply.
Current coupon opportunities in AN are thus on the near horizon. The highest coupon bond at this point is the 4.75% of 6-1-30 at $500 mn face value. The lowest coupon bond is the 1.95% of 8-1-28 with $400 million outstanding. A current coupon bond for AN would presumably come with a high 5% coupon using the current par weighted BBB tier YTW of 5.6% as a guide (6-14-24).

During 2023, AN negotiated terms in its amended and extended unsecured credit agreement to allow for the maximum leverage ratio covenant to increase from 3.75x to 4.25x for four fiscal quarters in the event that AN completes a material acquisition.
The new terms in the credit agreement replaced the maximum capitalization ratio covenant (prior ceiling of 70%) with a minimum interest coverage ratio covenant (3.0x).
The revised loan terms would appear to increase the odds of M&A activity, but the swing factor in such a case would be less deployment to buybacks (in theory).
While buybacks vs. M&A are not an “either/or” choice for the public dealers, the ability to strike a balance of the two is a challenge. So far, the dealers have navigated fairly successfully in maintaining credit quality, but the execution risk in very rapid expansion in the use of debt and used car stand-alone franchises has had mixed results so far in stock market reactions.
Captive Finance Operations

The fee-based F&I revenues are reported in the retail vehicle segments at the dealer level while the purely captive finance operations are in the start-up phase with the main challenges still ahead.
The vehicle segments sell F&I and Parts and Services products/services, so the reporting of segments relative and business lines combined gives a more complete picture when taken together of how the non-vehicle sales line items flow into revenues and earnings.
The disclosure on auto loans in the 10-K and 10-Q provides useful data on asset mix, allowance reconciliation, and loan quality (past dues, write-offs, etc.) and customer financial services revenue/profits are reported.
As detailed in the chart above, the net auto loans receivable balance is up over 70% since 2022 and will continue to grow rapidly during the next stage of growth in AN new and used car operations.
During 1Q24, AutoNation Finance originated $160 mn of auto loans as the gross auto loan balance climbed above $566 mn.
Based on management commentary on its 1Q24 call, AN expects over $700 mn of originations in 2024 with the business activity focused now solely on AutoNation stores with the expectation that the portfolio will more than double in FY 2024.
The finance operations bring a lot of accounting noise in the reported earnings requirements for a captive vs. a pure fee generator in third party securitized loans and non-recourse debt. AN has emphasized that the cash-on-cash return on equity has been solid.
AN highlighted that the loan quality continues to improve as it ramps up the captive business and grows the asset base away from its origins as CIG Financial.
Past due loans are moving lower but so is the allowance cushion. The provision vs. write-off relationship numbers will be lines to watch as the year unfolds and the auto loan balance grows.
For the new captive finance operation overall, AN is expecting to reach breakeven by early 2025 with the competitive advantage of a captive capability being utilized in the AutoNation stores.
The plan is that the portfolio will reach a scale that allows for expanded securitization in its funding operation, will help the core AN retail operations, and bolster the finance unit’s earnings contribution if the promised underwriting standards play out.
HIGHLIGHTS & HISTORY
Republic Industries to AutoNation…
The AutoNation family tree has a colorful history with its start as Republic Industries (the legacy AutoNation entity) as part of the H. Wayne Huizenga empire. Huizenga was a household name for the 1980s/1990s crowd, and his rapid expansion in used car retail and then the rapid growth in new car franchise dealerships eventually evolved into what today is AutoNation.
For a short list, Huizenga had a resume of businesses beyond today’s AutoNation that included starting Waste Management (1968), growing Blockbuster Video across the 1980s (later sold to Viacom for $8.4 bn), and along the way built a new waste management company under the Republic name (later named Republic Services, ticker RSG). RSG was spun off in1998 in an IPO with a subsequent distribution of shares (current market cap of RSG is $59 bn).
Huizenga also had hotel names on his impressive list of business ventures along with sports franchise ownership (Miami Dolphins, Florida Marlins, Florida Panthers).
Republic Industries became AutoNation as of 1999 and then spun off ANC Rental in 2000 with the Alamo Rent-a-Car and National Car Rentals in the mix. ANC Rental filed Chapter 11 in Nov 2001 (the 9/11 attack was the final blow), but that is another story for another time.
The public dealer rankings across the Big 6 franchise dealers…
AutoNation is the #2 franchise car dealer overall by units and #2 in new vehicles and #2 in used vehicles (note: the #2 franchise dealer category excludes CarMax and Carvana). The #1 franchise dealer is now Lithia.
The Big 6 public franchise dealers include Lithia (ticker LAD), AutoNation (AN). Penske (PAG), Group 1 (GPI), Asbury (ABG), and Sonic (SAH). PAG is the #1 in market cap ($9.9 bn Friday 6-14-24) ahead of LAD ($7.0 bn) and AN ($6.8 bn) with a gap to the next layer of ABG ($4.1 bn), GPI ($4.1 bn), and SAH ($1.9 bn).
The Big 6 public dealers comprise almost 1/3 of the units sold by the Top 150 dealers (per recent Automotive News rankings for 2023). That long tail of smaller dealers leaves a lot of room for more small-to-medium scale acquisition activity. There are boutique investment bankers that direct all of their attention to the auto dealer space given the steady volume of business, size of the deals, and specialized knowledge requirements.
On a side note, Warren Buffet/Berkshire purchased one of the largest private dealers (Van Tuyl Group) back in 2014. In the current market, the #7 private dealer in the rankings (Hendrick Automotive) is only slightly smaller than Sonic in total new vehicles sales but much smaller in used vehicles than Sonic.
AN quiet on the M&A front, bolt-ons and starting a captive finance operation…
So far, AN has taken a US-centric approach where some others (notably Penske and Lithia) have pushed more heavily into international markets such as the UK.
AN acquired CIG Financial in 4Q22 for $83 million plus repayment of $21 mn of obligations. AN and LAD are rare among dealers in pursuing growth initiatives in customer financing.
During Jan 2023, AN acquired RepairSmith, which is “a full-service mobile solution for automotive repair and maintenance.” The Parts and Services operation of AN comprise the highest margin operation, and RepairSmith offers another means of leveraging that business for growth.
AN purchased a small stake in TrueCar in 4Q22 with a goal of enhancing its digital strategies. AN was an early investor in Waymo and operates in partnership with Waymo on AV B2B parts deliveries among other initiatives. AN had also invested in Vroom back in 2018 and sold off their stake for a total $165 mn gain in late 2020/early 2021. That Vroom stake would be worth dramatically less today.
More traditional M&A was seen in 2021 with cash outlays of $433 million for 20 stores and 4 collision centers. We look at the M&A totals in the cash flow section above, and stock buybacks dwarf M&A.